



Every month I tell people the number on the screen is the result, not the story. What you want to know is why it moved. In June the why is unusually clean, so let's walk it.
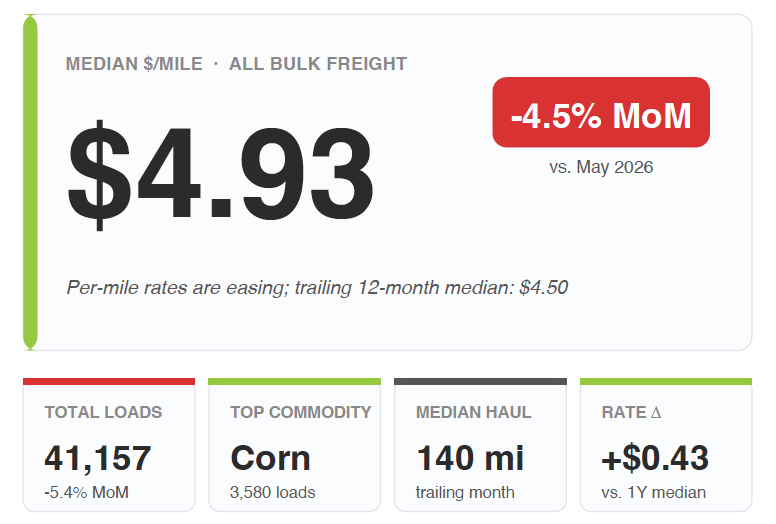
The blended median fell to $4.93 a mile, down 4.5% from May across 41,157 verified loads. But here's the tell: this wasn't one segment dragging the average. Every commodity group moved down together. Grain off 5%, aggregates off 5%, feed off 3%. When the entire board slides in lockstep like that, you stop looking at demand and start looking at the cost stack. And the cost stack in June was all about fuel.
The driver: diesel is falling fast
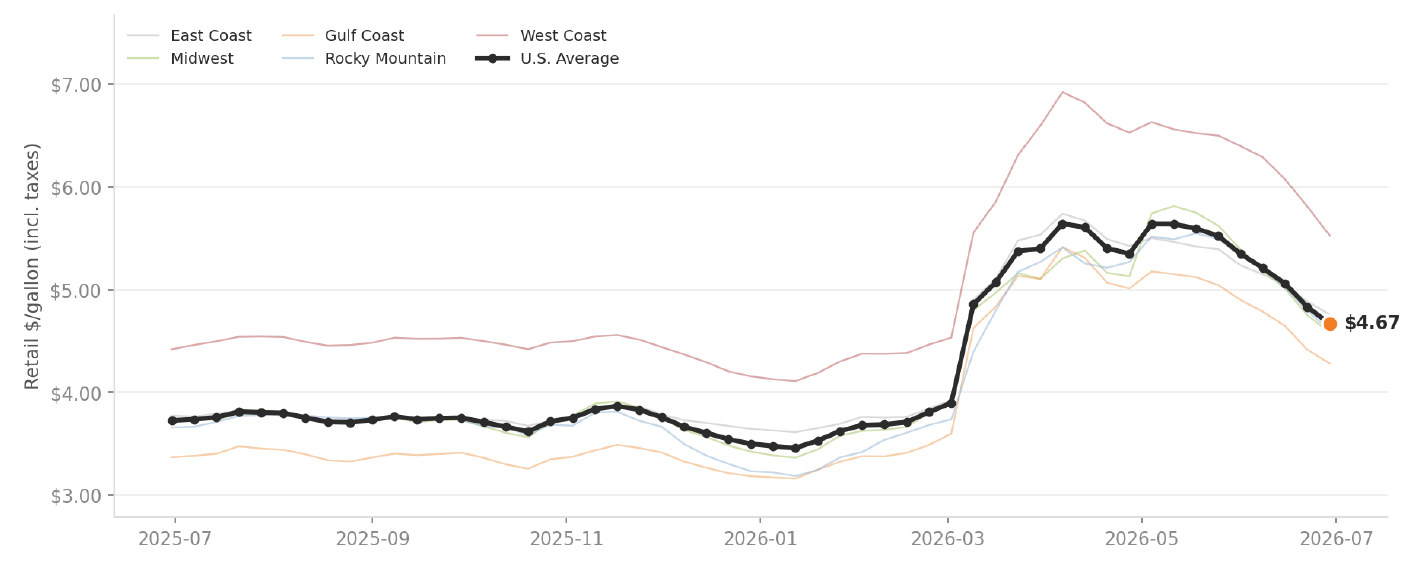
EIA Weekly Retail On-Highway Diesel Prices · Latest reading: June 29, 2026 · PADDs: R10 East Coast / R20 Midwest / R30 Gulf / R40 Rocky Mountain / R50 West Coast.
This is the chart that explains the month. The US average dropped to $4.67 a gallon, down 12.7% in a single month and 13.6% over the trailing three. That is a big, fast move, and it's the clearest reason rates eased across the board.
Here's the mechanism, because it changes how you should price from here. Fuel is the second-largest variable cost in this business. When diesel was spiking through the Iran conflict, it propped rate floors up all year. Now that the ceasefire is holding and oil has come back toward pre-war levels, that support is coming out, and floors are following it down. The same force that inflated your rates is now deflating them. That's not soft freight demand. That's fuel normalizing.
What to expect next: the bias is for continued easing, but not a straight line. Barrels are still working their way back through the Strait of Hormuz, and analysts expect that traffic won't fully normalize until into 2027. So plan for diesel to keep grinding lower in fits and starts, with the occasional headline-driven bounce. The direction is down. The path is bumpy.
Corn cooled with everything else, but keep it in perspective
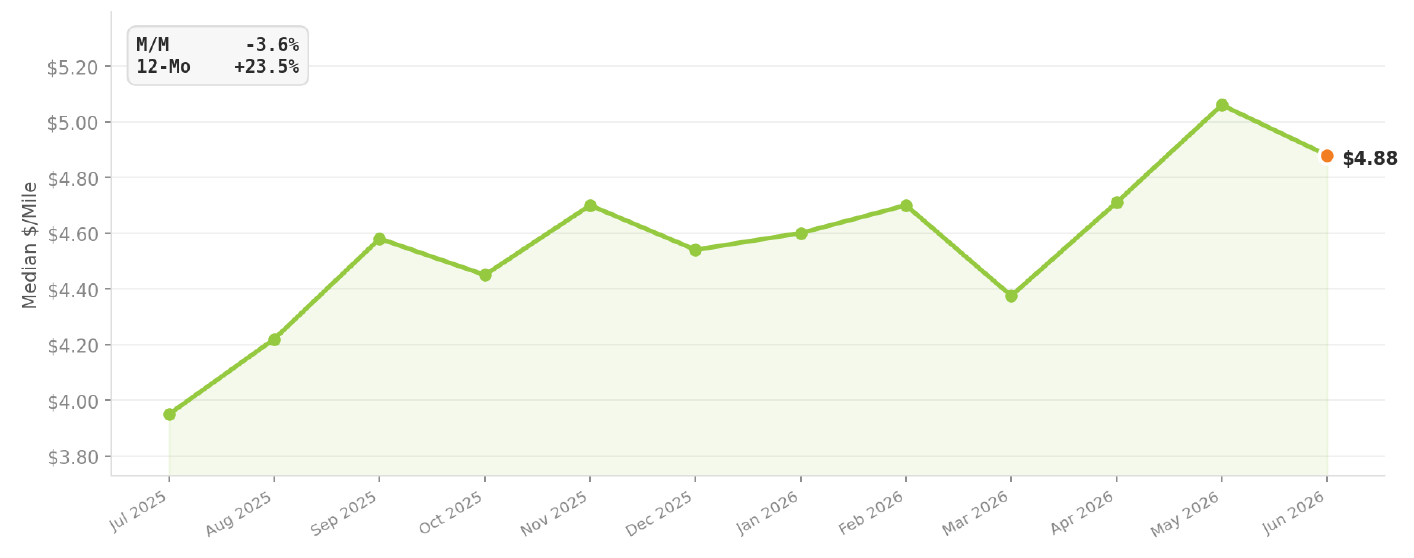
BulkLoads verified carrier submissions · 3,580 Corn loads in June 2026.
Corn was still the most-hauled product in the network at 3,580 loads, but its rate eased 3.6% on the month to $4.88. Don't lose the forest for the trees though: corn is still up 23.5% year over year. The bellwether didn't break, it exhaled along with the rest of the market as fuel came down.
The map cooled almost everywhere
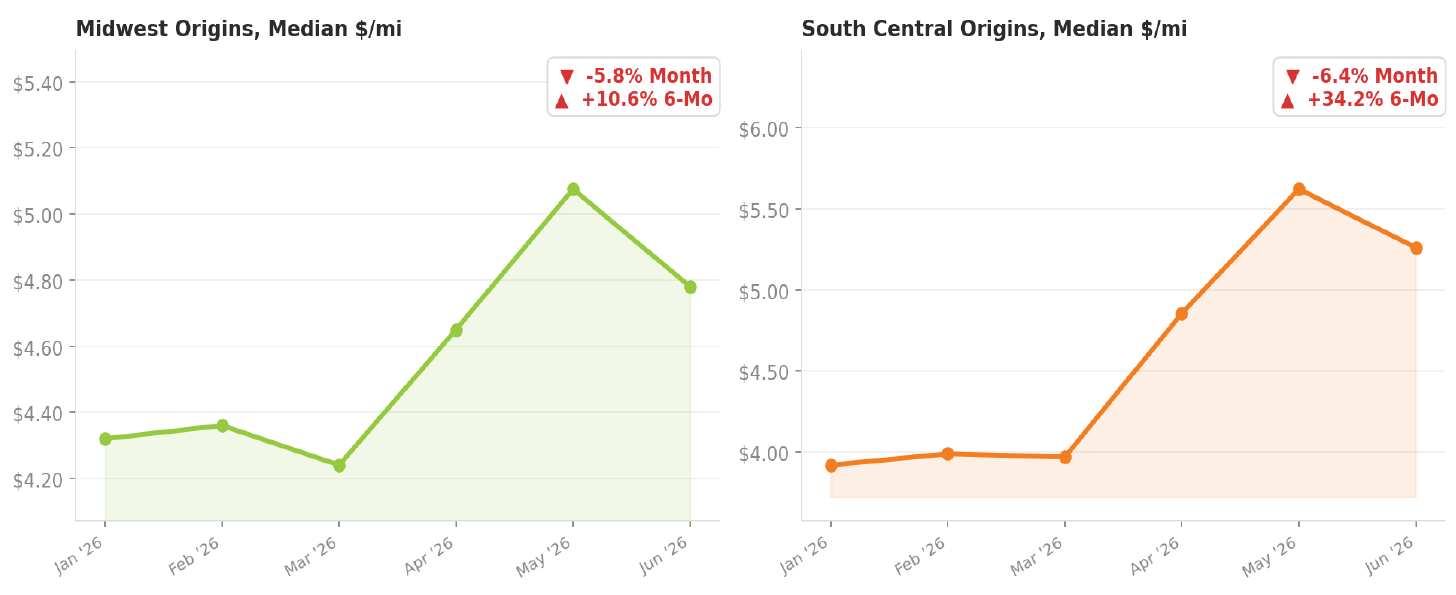
Median per-mile rates for loads originating in each region over the trailing 6 months. Midwest = corn-belt grain states (IA, IL, IN, OH, MI, WI, MN, MO, KS, NE, SD, ND). South Central = TX, OK, NM.
When fuel pulls the floor down, it pulls it down most places at once. Both the Midwest (-5.8%) and South Central (-6.4%) cooled on the month, even though both are still up big over six months (+10.6% and +34.2%). The West softened most at -8.9%. The Northeast was the lone region firming, up 2.7%. One region up, everything else down, is exactly the footprint of a fuel-led move rather than a demand-led one.
What I'd watch into July
- Diesel, full stop. It drove June and it'll drive July. The relief is real and likely continues, but the recovery in global supply is gradual, so expect volatility around the trend.
- Whether volume stabilizes. Loads eased 5.4% as spring movement wound down. Watch for the harvest-season floor to form.
- The number under the number. Even after this pullback, the median sits $0.43 above the trailing 12-month median. The floor reset higher and it's holding. Don't confuse a fuel-driven dip with a weak market.
The carriers and shippers who win the back half of this year won't react to last month's number. They'll price the fuel move while it's still moving.
That's exactly what we built BulkLoads Insights to do: real-time rate quoting by lane and commodity, fuel-adjusted estimates that move with the diesel curve, and verified, transaction-backed data behind every number here. Bring your toughest lane and book a 30-minute walkthrough with me at bulkloads.com/bulk-insights/. I'll show you the data.
John F. Calloway · Chief Commercial Officer · [email protected] · (417) 501-3934