



For three months I've been telling you the same thing: the number on the screen is the result, not the story. In July the story is what didn't happen. After a spring of fuel-driven decline, rates barely moved. And that's the most important thing in this report.
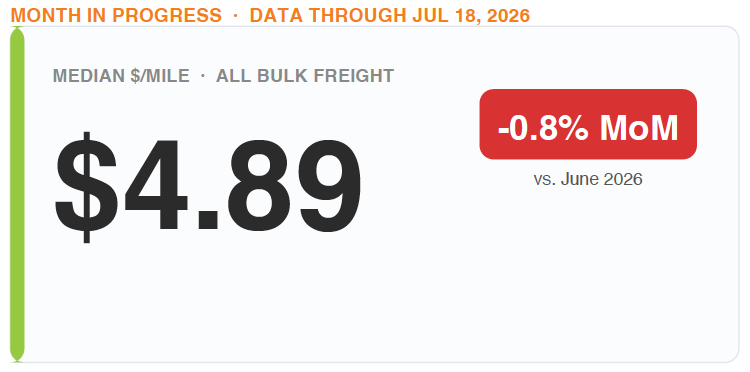
The blended median came in at $4.89 a mile through July 18, down just 0.8% from June. Put that next to June's 4.5% drop and you see it: the bleed leveled off. Rates aren't collapsing. They're finding a floor, and that floor is sitting 18.1% above where it was a year ago.
The real signal: dispersion is back
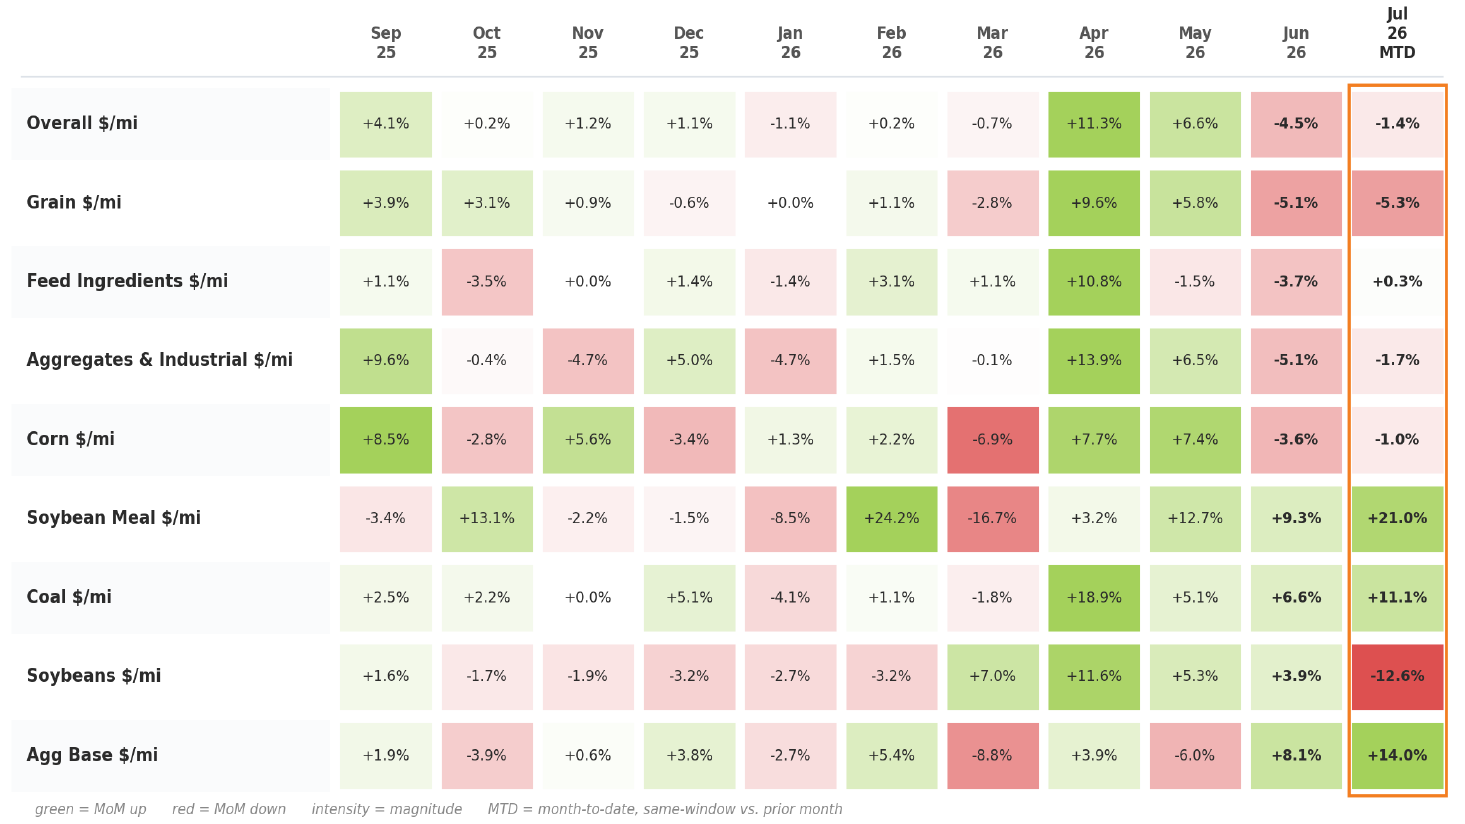
Here's what tells me the market is healing. Look at how differently commodities moved this month. Soybean meal ripped 21% higher. Coal climbed 11%. Ag base jumped 14%. Meanwhile soybeans fell nearly 13% and grain slipped another 5%. Some up big, some down big.
That's a functioning market. Remember June, when literally every group fell in lockstep? That was a single macro cost, fuel, dragging the whole board down at once. When you get real dispersion back, winners and losers pulling in opposite directions, it means the macro fog is lifting and individual commodity fundamentals are back in the driver's seat. Supply, demand, and season are setting prices again instead of one diesel-shaped shadow over everything. That's the healthiest thing I've seen in the data in months.
Fuel found a shelf
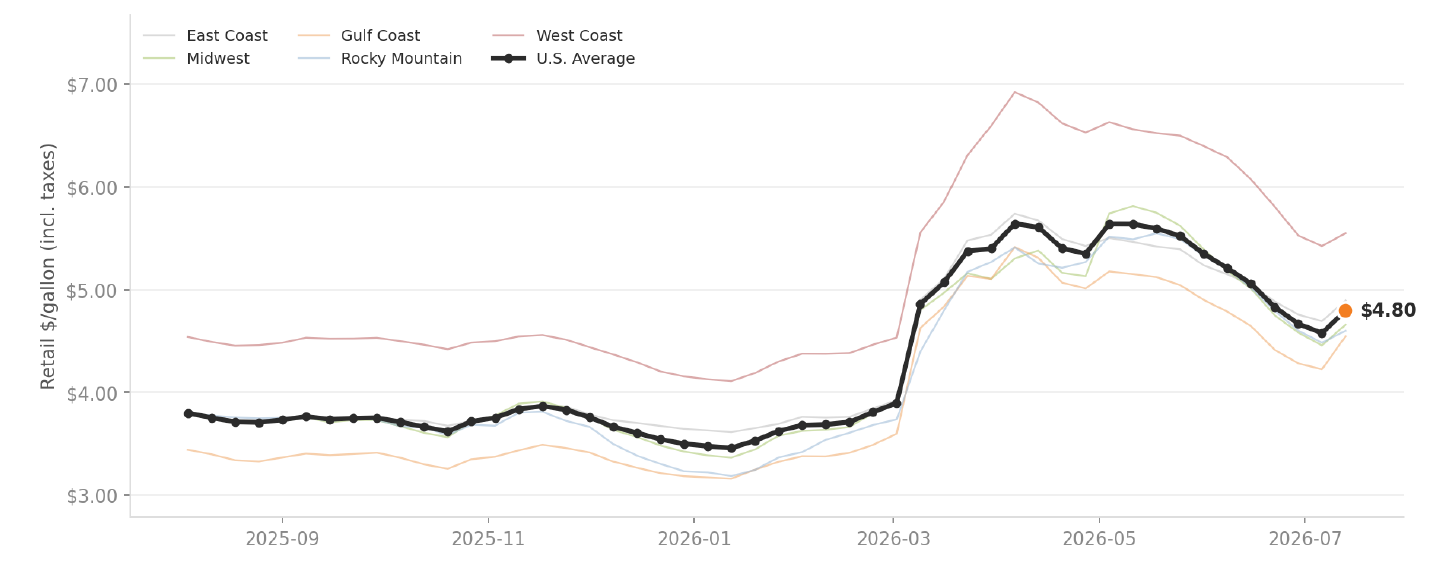
EIA Weekly Retail On-Highway Diesel Prices · Latest reading: July 13, 2026 · PADDs: R10 East Coast / R20 Midwest / R30 Gulf / R40 Rocky Mountain / R50 West Coast.
The stabilization lines up with fuel. Diesel's freefall slowed to a walk. The national average sits at $4.80 a gallon, and if you look at the last few weeks, the line actually flattened out and ticked up slightly off its lows. After months of straight-down, that matters. When fuel stops falling, the pressure it was putting on rate floors stops too. That's a big part of why rates held this month, and it's the number I'd watch hardest into August. If diesel bounces, rates firm. If it resumes falling, expect another leg down.
Corn cooled, but keep perspective
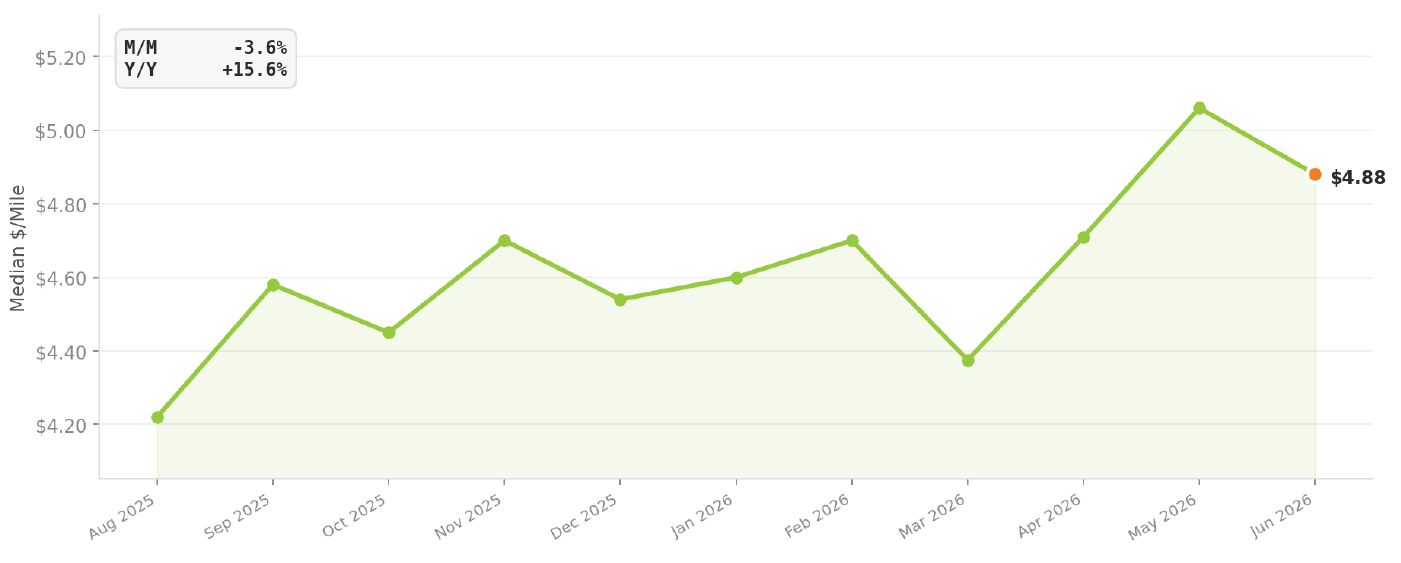
BulkLoads verified carrier submissions · 1,910 Corn loads in July 2026.
Corn was still the most-hauled product at 1,910 loads, easing 3.6% to $4.88. But it's still up 15.6% year over year. The bellwether is drifting, not breaking.
A few things I'm watching
- Volume looks ugly, don't overreact. Loads are down 29.6% month-to-date, but that's a partial-month figure caught in the mid-summer lull between planting and harvest, with a holiday week in it. Weekly counts are running near normal. Watch for the harvest ramp to firm it up.
- The regional map flipped. West origins firmed +10.7% while the Northeast softened 5.1%, a complete reversal from June. When regions start moving independently again, that's the same dispersion signal showing up geographically.
- Diesel's floor. Everything hinges on whether fuel holds this shelf or takes another leg down.
The operators who win the back half of this year won't react to a single month's print. They'll read the pattern: a market finding its footing, with fundamentals back in charge.
That's exactly what we built BulkLoads Insights to do: real-time rate quoting by lane and commodity, fuel-adjusted estimates, and verified, transaction-backed data behind every number here. Bring your toughest lane and book a 30-minute walkthrough with me at bulkloads.com/bulk-insights/. I'll show you the data.
John F. Calloway · Chief Commercial Officer · [email protected] · (417) 501-3934